


If you’ve ever worked on any PHP application, or package, or anything you know that debugging performance issues is hard. There are several ways to ease the pain a little: debug bars, putting timers a bit everywhere. Or if you’re courageous like I was for a long time, you use xdebug snapshots which requires you to configure it, and then parsing the snapshots which takes a long time, etc.
Recently Blackfire came out of beta, it’s a tool aimed at making all these profiling options a thing of the past by providing a modern powerful performance analysis tool, that is both quick and easy to use. When I discovered it during its first public beta I was like a kid in a toy store. Where all the toys would be made of candy.
Today I want to make you discover Blackfire if you don’t already know it, because I feel like it’s not as known as it should be.
Blackfire
Blackfire is a tool created by Sensiolabs – which you may know from this little unknown framework called Symfony or from SensioLabs Insights. It’s tailored for doing advanced performance profiling of PHP applications – be it web applications, CLI tools, packages, etc. Anything really. And it is amazing.
Setup
First, it is very easy to install, and the documentation to do so will get you started in 30 seconds. If you’re on a Mac per example this is how you install Blackfire:
brew tap blackfireio/homebrew-blackfire
brew install blackfire-agent

sudo blackfire-agent -register
And that’s it. Even better: want to install Blackfire from a service like Forge, Fortrabbit or Heroku? It’s integrated right into them, just need to fill a form and you’re good to go:
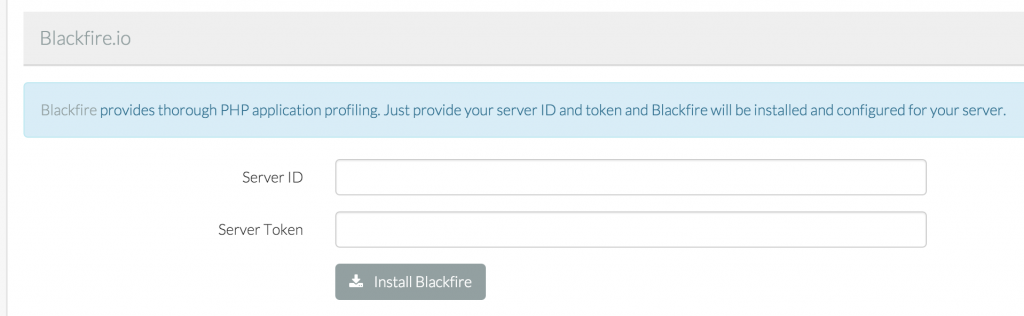
You can see more information in the Getting Started of the documentation.
Profiling web applications
Now that we have Blackfire, what can we do with it? Let’s try to profile the performances of a PHP web application. It can be any application, you do not need to add any code to it. Blackfire just has to be installed on the server that runs it and it’ll hook itself into PHP to gather statistics.
The easiest way to debug an application on a server where Blackfire is present is to get the Chrome extension (or Lynx or whatever). Then go on a webpage, click on the Blackfire icon, and then on the big red “Profile” button. You will see a bar appear at the top of your page, it’ll run for a very short while and then give you information about the current request:

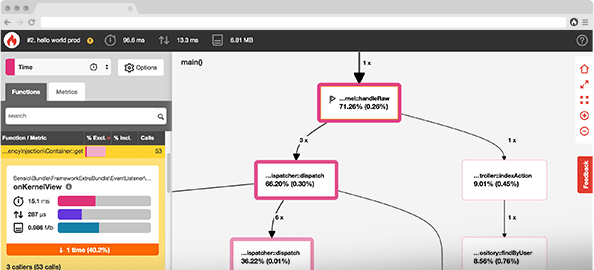
Now click on the other big red “View profile” button and you should be redirected to a screen that looks like this:
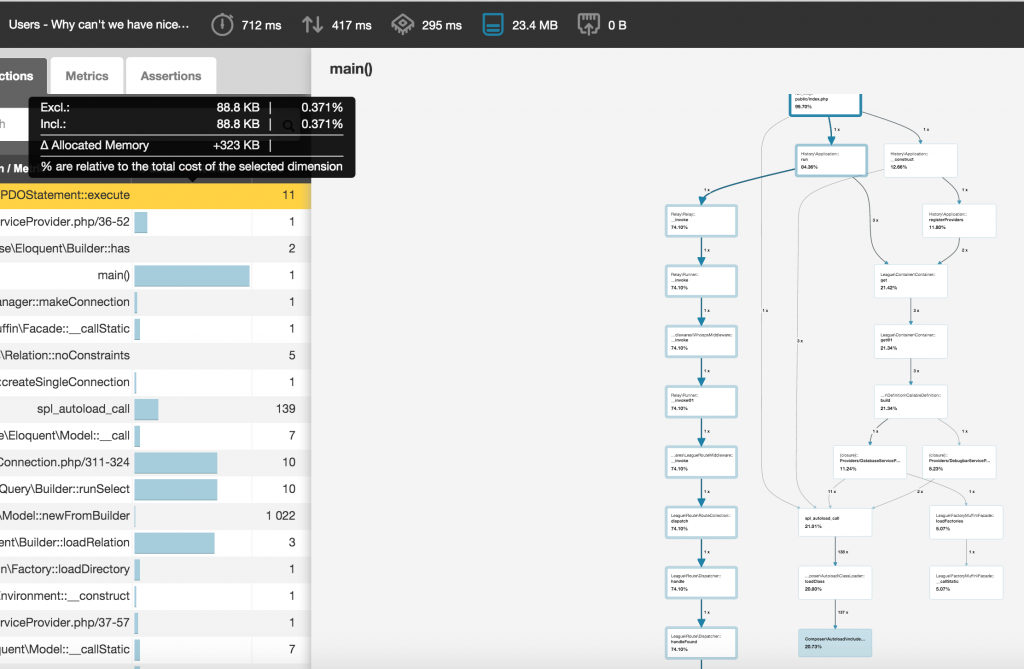
Understanding Blackfire profiles
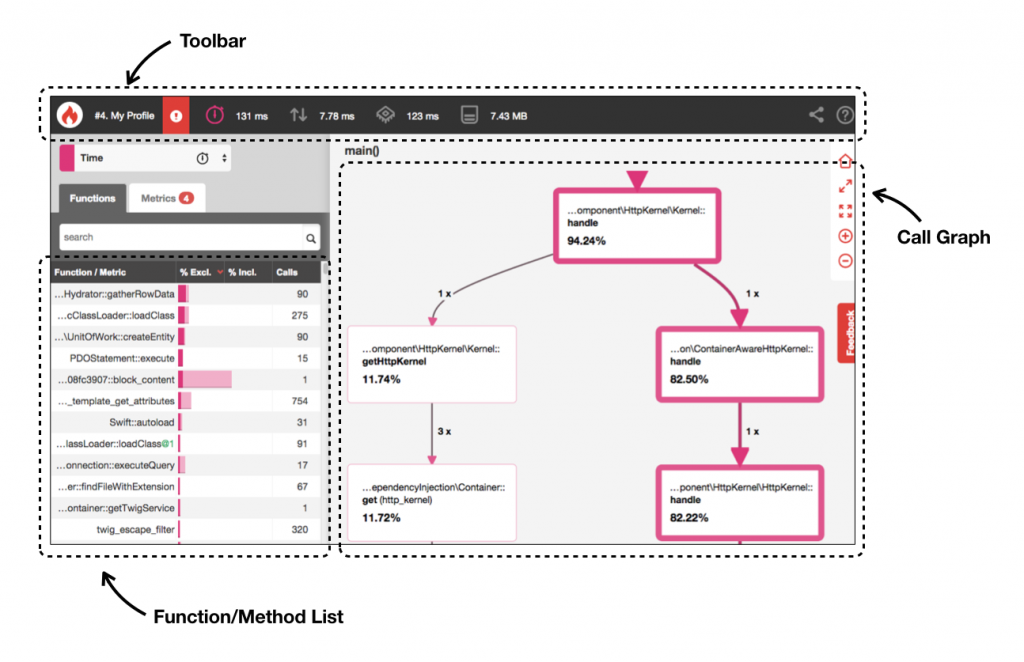
The screen is split into three parts:
- The toolbar
- The function list
- The call graph
The most important one is the call graph: it is a visual representation of all the methods that were called during the current request, and which of them took up most of the time. Blackfire will highlight which paths in your application are also the most time-consuming ones, those are called hot paths.
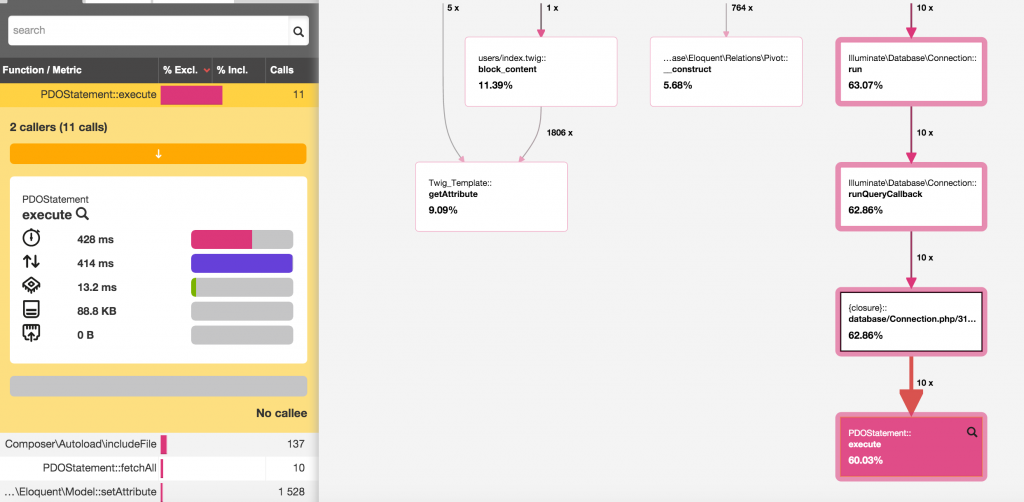
You’ll also see nodes with a colored background, those are the most intensive nodes of your request. If you click on one you’ll see it highlighted with more information on the part on the left of the screen: the function list. It’ll tell you, in general during this request, how much exclusive time was spent in this method – eg. without considering calls this method might have made to other methods. Just, the time it took by itself. You can switch that to inclusive time by clicking on the headers at the top of the list of methods.
You can also sort by number of calls to this method to detect if something might be wrong. Like if you have a method that should be called once but is instead called 3400 times then you fucked up.
If you’re not interested in time spent but rather more in CPU consumption per example, you can use the toolbar at the top of the screen. The global metrics for this request also act as tabs, if per example you click on the Memory icon you’ll see the same screen as before but in blue, representing which paths/methods in your application took up the most memory during this request:
Profiling CLI applications
Now web applications are pretty common but one of the most important appeals of Blackfire to me is CLI profiling which was very painful to do with xdebug (for all I know I was doing it wrong). Say you have a deploy command for your application that is slow and you want to know why? Or you have a scheduled job running on your queue and want to see how fast it is, see if you can improve it?
All you have to do is prepend your command with blackfire run. That’s it:
# Before
artisan some:scheduled-job

# After
blackfire run artisan some:scheduled-job
Your command will run and Blackfire will give you a link to the profile and some information: time it took, number of SQL requests, etc.
Blackfire Run completed
Profile URL: https://blackfire.io/profiles/28e26641-fd38-4aac-a600-ba3851511612/graph

Wall Time     2.49s
CPU Time      2.24s
I/O Time      252ms
Memory       10.8MB
Network         0µs     21B     1rq
SQL           665µs     7rq
If you’re afraid your one test run is not representative and would like to get an “average” view of performances you can also use the --samples flag to execute something X times and create a profile from the average metrics of those X times:
blackfire run --samples="10" artisan some:scheduled-jobWould run our job 10 times per example.
References and comparisons
Now once you have your first profile and you start working on it, most likely you’ll want to know more precisely the impact of each change on the performances. That’s where references come into play: they’re special profiles that serve as “reference point”. You can create one by picking “Create new reference” from the Chrome extension dropdown or passing the --new-reference flag in the CLI.
Once you do another profile, you’ll be offered the possibility to compare to that reference from the dropdown (or through the --reference={reference-id} flag). If you do that you’ll see a slightly different profile screen which compares every metric to the reference profile:
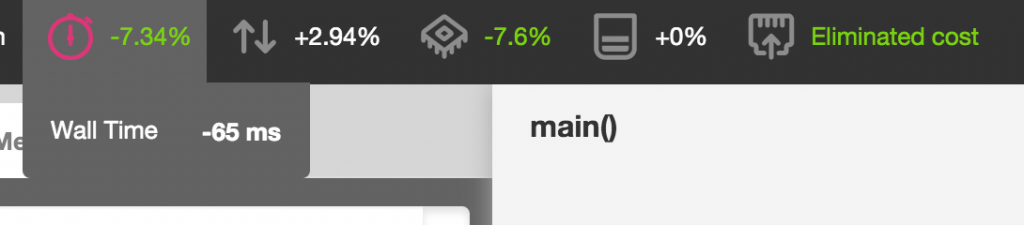
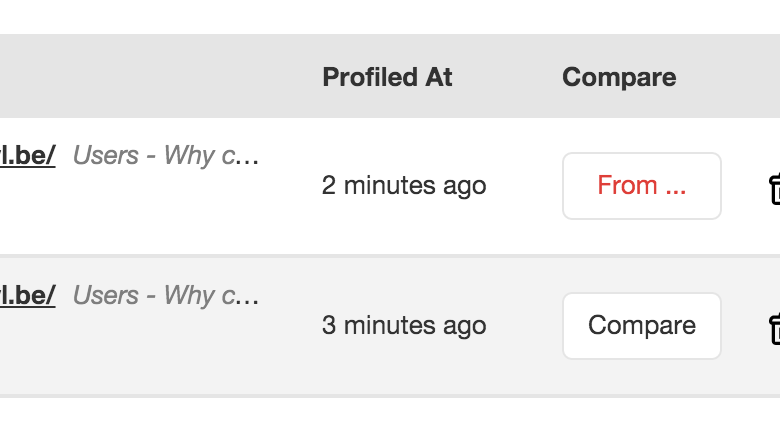
This gives you the ability to measure your progress as you make changes and see if you’re going into the right direction or not. Note that you can also compare two profiles quickly (any profile) on your Blackfire dashboard:
Profiling APIs and web services
You can also profile any URL or API by using the blackfire curl command. Options are the same as for blackfire run so you can use samples and things like that. Note that the server has to have the Blackfire PHP extension, same as for web applications (since principle is the same anyway):
blackfire curl http://my-website/api/some-callYou can even straight up copy curl requests from the Chrome devtools and pass them to Blackfire:

Once you have profiles, you can share them to anybody via the little share icon at the top right corner of any profile. You can even embed those profiles into any page via an iframe:
Performance assertions
Once your application is so smooth that you won’t believe it’s not butter, ideally you’d like it to stay that way. This can be done through performance assertions: they’re a special feature of Blackfire, only available for subscribed users (we’ll get back to that).
For this you write a .blackfire.yml file which describes how well your app should do, per example
tests:
  "Homepage should not hit the DB":
    path: "/"                                 # only apply the assertions for the homepage
    assertions:
      - "metrics.sql.queries.count == 0"      # no SQL statements executed
      - "main.peak_memory < 10mb"             # memory does not exceed 10mb
      - "metrics.output.network_out < 100kb"  # the response size is less than 100kb
  "My queue job should be fast enough":
    command: "artisan some:scheduled-job"
    assertions:
      - "main.wall_time < 2s" # wall clock time is less than 2s
Now every time you run Blackfire it’ll add a new tab on your profiles showing you if your profile failed those tests or not. And you can test any metrics (memory, CPU, time) and you can also run comparisons against references and all kinds of things – it’s a really powerful feature. You can see more in detail what is possible in the documentation.
Can I use it now?
Now Blackfire is free of use for anybody, but data retention is limited and some features are locked (like performance assertions). Unfortunately the first non-free plan is more tailored for teams as it starts at 100€/month (or 80€/month if you pay yearly). So if you’re a standalone developer or very small company you’ll most likely have to use the free plan, which is what I use personally. Blackfire is nonetheless an awesome tool and you can already do so much with the free plan that you won’t feel limited.
If you haven’t tried it yet I recommend you give it a shot, and maybe you’ll discover bottlenecks in your application that are easily solvable and that you weren’t even aware of.


Member discussion